Published on Tue Mar 18 2025
Written by Nacho Consolani

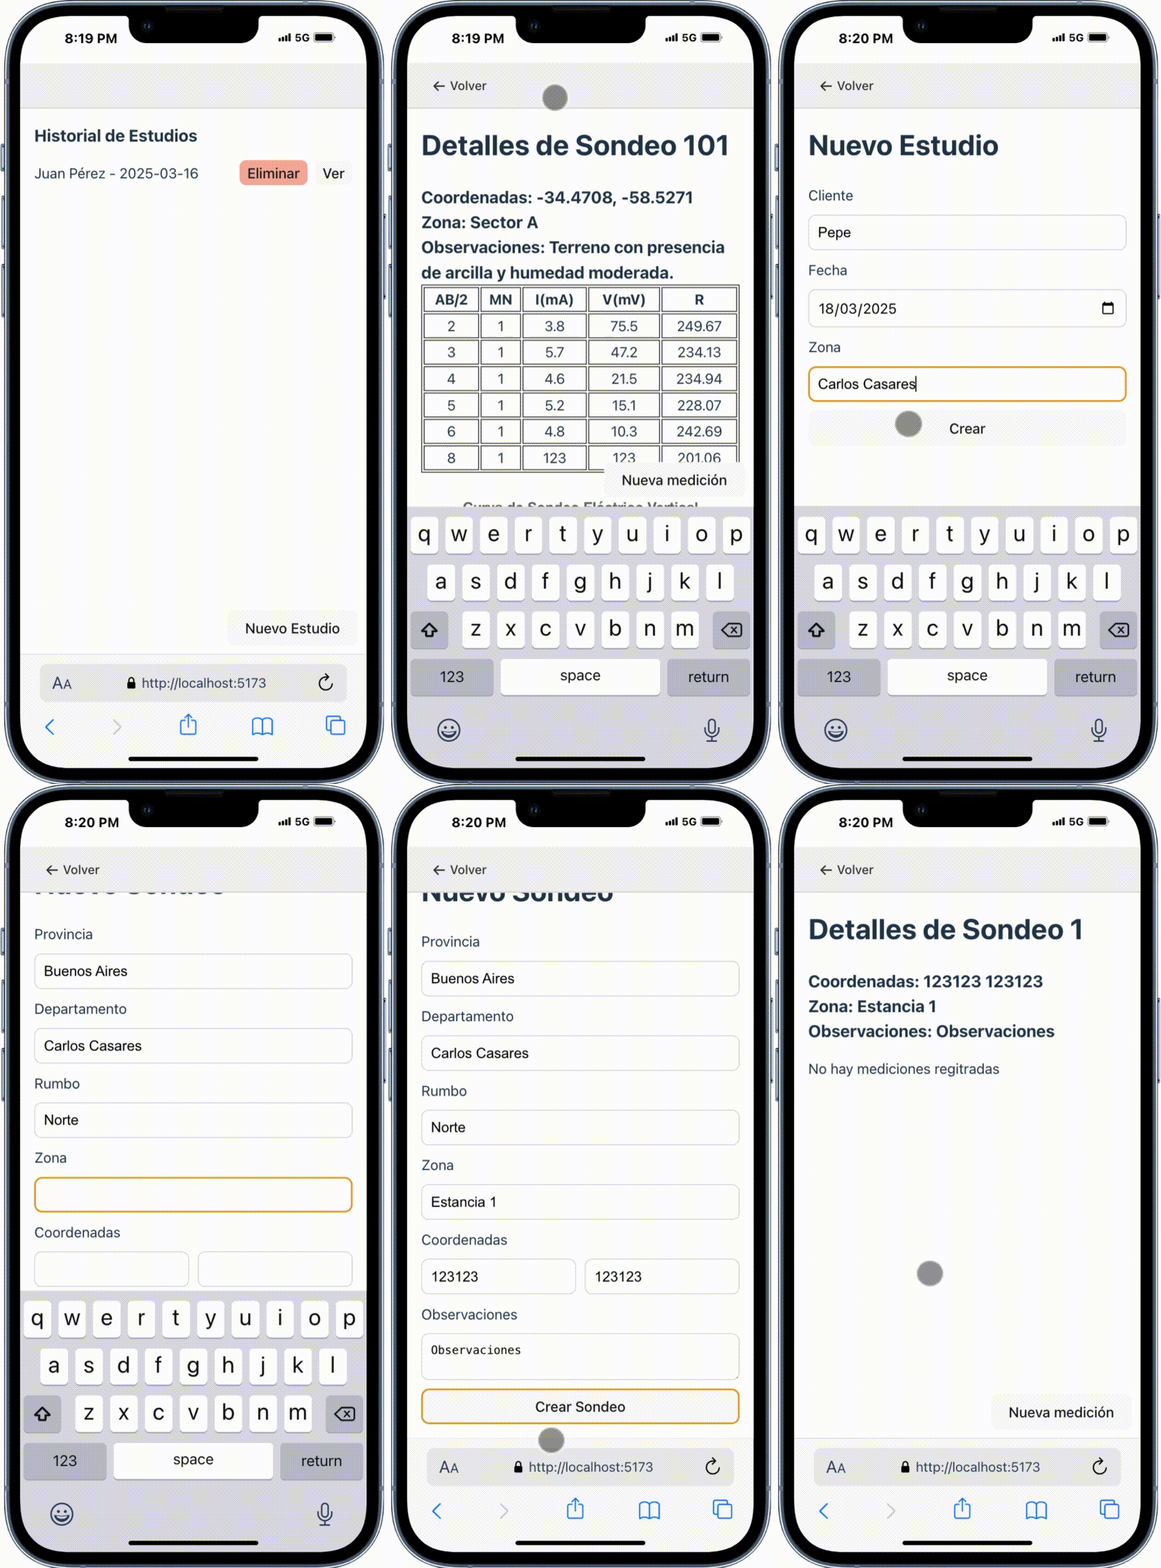
In this post, I’ll share my experience building a web application for managing and analyzing electrical sounding data for geophysical studies. This project was born from the need to modernize and streamline the process of managing geoelectrical studies, vertical electrical soundings (SEV), and their measurements.
The main challenge was to create a system that could handle complex geophysical data while providing an intuitive interface for users. The application needed to manage three main entities:
Each study can contain multiple SEVs, and each SEV can have multiple measurements, creating a hierarchical data structure that needed to be efficiently managed and displayed.
For this project, I chose a modern and efficient tech stack:
The first step was setting up the project structure. I chose Vite as the build tool for its excellent developer experience and fast hot module replacement. The project structure was organized to separate concerns:
/
├── src/          # View/presentation layer
│   ├── app/      # Main application components
│   ├── components/ # Reusable UI components
│   ├── hooks/    # Custom React hooks
│   ├── store/    # MobX state management
│   └── assets/   # Static assets
└── lib/ # Core business logic and utilitiesOne of the key architectural decisions was to use Object-Oriented Programming principles with MobX for state management. This approach proved particularly effective for modeling the domain entities. Here’s an example of the Medicion (Measurement) class that demonstrates our OOP approach:
export class Medicion {
  constructor(
    private readonly a_b_sobre2: number,
    private mn: number,
    private intensidad: number,
    private tension: number
  ) {}

  getID() {
    return `${this.a_b_sobre2}-${this.mn}`;
  }

  getResistividadAparente() {
    return (this.tension / this.intensidad) * Math.PI * this.a_b_sobre2 ** 2;
  }

  getA_B_Sobre2() {
    return this.a_b_sobre2;
  }

  getMN() {
    return this.mn;
  }

  getIntensidad() {
    return this.intensidad;
  }

  getTension() {
    return this.tension;
  }

  toJSON() {
    return {
      a_b_sobre2: this.a_b_sobre2,
      mn: this.mn,
      intensidad: this.intensidad,
      tension: this.tension,
      resistividad_aparente: this.getResistividadAparente(),
      id: this.getID(),
    };
  }
}
This class demonstrates several key aspects of our OOP approach:
a_b_sobre2 field is readonlygetResistividadAparente method encapsulates the calculationtoJSON method handles data transformationThe same principles were applied to more complex classes like Estudio and SondeoElectrico, which manage collections of measurements and implement additional business rules.
This OOP approach with MobX provided several benefits:
The lib folder contains the core business logic separated from the UI components. This includes:
This separation of concerns made the codebase more maintainable and testable, as the business logic could be tested independently of the UI.
A comprehensive testing strategy was implemented using Bun’s test runner:
// Unit tests for business logic
describe("Estudio", () => {
  it("should add a new sondeo", () => {
    const estudio = new Estudio("Test Client", new Date(), "Test Zone");
    const sondeo = new SondeoElectrico(
      "Test Province",
      1,
      "Test Dept",
      "N",
      "Test Zone",
      new Date(),
      "0,0",
      "Test Observations"
    );
    estudio.addSondeo(sondeo);
    expect(estudio.getSondeos().length).toBe(1);
  });
});
The testing approach focused on:
Managing the hierarchical data structure was a crucial challenge. The combination of OOP and MobX provided a robust solution for state management:
The application uses React Router for navigation, with routes designed to reflect the hierarchical nature of the data:
<Routes>
  <Route index element={<App />} />
  <Route path="/e/create" element={<NuevoEstudio />} />
  <Route path="/e/:eid" element={<ViewEstudio />} />
  <Route path="/e/:eid/edit" element={<EditEstudio />} />
  <Route path="/e/:eid/s/create" element={<NuevoSondeo />} />
  <Route path="/e/:eid/s/:sid" element={<ViewSondeo />} />
  <Route path="/e/:eid/s/:sid/m/create" element={<NuevaMedicion />} />
</Routes>One of the most challenging aspects was implementing the electrical sounding curve visualization. Chart.js was chosen for its flexibility and performance. The implementation required careful consideration of:
To enhance the user experience, I implemented PWA features using vite-plugin-pwa. This allows users to:
Challenge: Keeping the UI in sync with the data model while maintaining performance.
Solution: Implemented efficient MobX stores with computed properties and reactions, ensuring that updates are propagated only when necessary.
Challenge: Creating smooth and responsive charts for electrical sounding data.
Solution: Used Chart.js with custom configurations and optimizations, implementing data windowing for large datasets.
Challenge: Ensuring the application works well on all devices, especially for data input on mobile.
Solution: Implemented a responsive design with mobile-first considerations and touch-friendly interfaces.
Challenge: Testing complex state interactions and side effects.
Solution: Created comprehensive test suites using Bun’s test runner, with mock data generators and helper functions.
The project is continuously evolving, with planned improvements including:
Building this geoelectrical data management system has been an exciting journey. The combination of modern web technologies, OOP principles, and careful architecture decisions has resulted in a powerful and user-friendly application. The challenges encountered were significant but surmountable, and the solutions implemented have created a solid foundation for future development.
The project demonstrates how modern web technologies can be effectively used to solve complex domain-specific problems while maintaining good user experience, performance, and code quality through proper testing and architectural decisions.